
TCU
4–4 · Ours #43Our rank on the rankings page. The board's line comes from the betting model, which sees more than this one number.
19–29Our projected score

AP #22Arizona
6–2 · Ours #18Our rank on the rankings page. The board's line comes from the betting model, which sees more than this one number.
Win chanceHow often each team wins the game outright when we play it out thousands of times from our line.ARIZ 73%
ARIZ 73%SpreadThe betting line right now: the middle of the sportsbooks we track, updated through the day.—oursOur computer's point spread for this game, built from team stats, not from the betting odds. Read it like a betting line: −7 means we have that team winning by 7. ARIZ −9.8
TotalThe betting line right now: the middle of the sportsbooks we track, updated through the day.—oursOur computer's projected combined score for both teams, built from team stats, not from the betting odds. 48.3
Our call · No priceNeither DraftKings nor FanDuel is offering our side at our number right now, so there is no price to judge.—
Quarterbackslast game's starter · most dropbacks in each team's last game
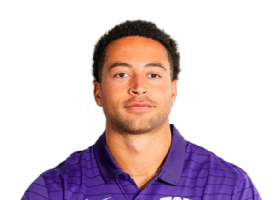 Jaden Craig
Senior · 7 starts this year
- EPA / dropbackExpected points added per dropback: passes, sacks (college play-by-play logs scrambles as runs). The rank is among the 128 FBS passers with 15+ dropbacks per team game.
- +0.1651st
- Comp %
- 67.4
- TD
- 11
- Turnovers
- 66 INT · 0 fum
- Sacked
- 20
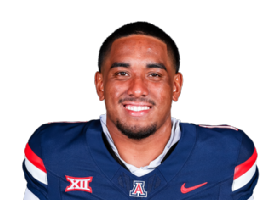 Noah Fifita
Senior · 7 starts this year
- EPA / dropbackExpected points added per dropback: passes, sacks (college play-by-play logs scrambles as runs). The rank is among the 128 FBS passers with 15+ dropbacks per team game.
- +0.3019th
- Comp %
- 74.2
- TD
- 18
- Turnovers
- 44 INT · 0 fum
- Sacked
- 16
The matchupeach offense against the defense it faces · FBS rank in the colored cell
| Arizonaoffense | Defense edge · 4 of 5 | defenseTCU | ||
|---|---|---|---|---|
| 17th | +0.21 | Overall efficiencyEfficiencyExpected points added per play. FBS average: +0.08. | −0.09 | 16th |
| 16th | 49.7% | Success rateSuccessShare of plays that keep the offense on schedule. FBS average: 43.3%. | 34.9% | 12th |
| 11th | +0.33 | PassingPassingExpected points added per dropback. FBS average: +0.09. | −0.12 | 16th |
| 81st | +0.05 | RushingRushingExpected points added per run. FBS average: +0.07. | −0.06 | 32nd |
| 29th | 14.8% | Big playsBig playsShare of plays gaining 20+ yards passing or 10+ rushing. FBS average: 12.7%. | 8.8% | 10th |
| TCUoffense | Defense edge · 5 of 5 | defenseArizona | ||
|---|---|---|---|---|
| 113th | −0.01 | Overall efficiencyEfficiencyExpected points added per play. FBS average: +0.08. | −0.01 | 44th |
| 83rd | 41.6% | Success rateSuccessShare of plays that keep the offense on schedule. FBS average: 43.3%. | 35.1% | 15th |
| 59th | +0.10 | PassingPassingExpected points added per dropback. FBS average: +0.09. | −0.01 | 49th |
| 135th | −0.15 | RushingRushingExpected points added per run. FBS average: +0.07. | −0.01 | 50th |
| 108th | 10.8% | Big playsBig playsShare of plays gaining 20+ yards passing or 10+ rushing. FBS average: 12.7%. | 10.0% | 25th |
Team stats
| ArizonaARIZ | TCUTCU | |
|---|---|---|
| Special teams & field position | ||
| Special teamsSpecial teams expected points added per game. | +0.950th | +0.952nd |
| Field positionAverage starting field position against the opponent's, in yards. | +0.967th | +2.640th |
| Drives & pace | ||
| Scoring chancesShare of drives that reach the opponent's 40. | 59%16th | 54%51st |
| Points per chancePoints scored per drive that reaches the opponent's 40. | 4.3746th | 3.11123rd |
| Time of possession | 31:0627th | 30:3633rd |
| Plays per game | 6761st | 6767th |
| Turnovers & havoc | ||
| Turnover margin | −1 | +1 |
| Giveaways – takeaways | 12 – 11 | 15 – 16 |
| Havoc rateShare of defensive plays with a sack, tackle for loss, interception or forced fumble. | 14.0%71st | 14.1%68th |
Season so far
TCU4–4 · 38th-hardest schedule
L vs North Carolina10–15missed −7.5
Wvs Grambling63–7covered −44.5
W vs Arkansas State31–7covered −19
L at UCF13–21missed −3.5
L vs BYU10–17missed +6
W at Baylor17–6covered +5
L vs West Virginia20–24missed −11
W vs Kansas22–16missed −6.5
Arizona6–2 · 73rd-hardest schedule
Wvs Northern Arizona35–7missed −33
Lat BYU17–28missed +7
at BYU17–28missed +7W vs Northern Illinois42–17missed −34.5
W at Washington State34–24missed −10.5
W vs Cincinnati34–7covered −7
Wat West Virginia52–31covered −3.5
at West Virginia52–31covered −3.5W vs Iowa State39–3covered −12
L at Texas Tech26–34missed +3.5
Model cfb_scratch · uncertainty ±15.5 · run Oct 31, 6:20 PM EDT · freezes at kickoff and grades as-is